Horse Racing Odds Formats — Fractional, Decimal and American Compared
 Available in US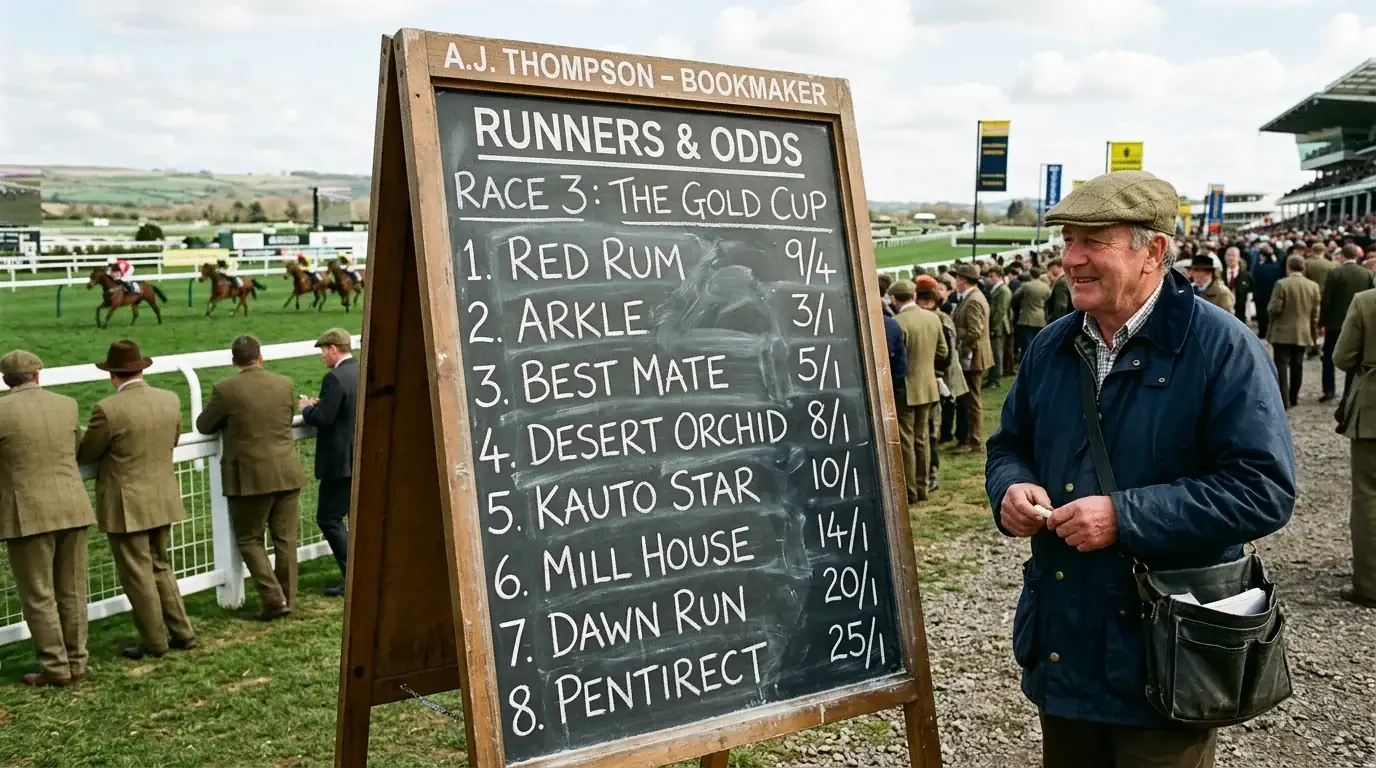
The notation that quietly costs people money
I once watched a punter at a Lingfield bookmaker pitch ask the price on the favourite, get told “11/4”, and walk away looking confused. He stood near the bar for a minute, did the maths on his phone, came back and put a tenner on. The whole interaction took about ninety seconds. He had needed every one of them to convert 11/4 into a number he could compare with another price quoted to him as “3.7” on his bookmaker app. The same horse, the same race, two different formats — and a ninety-second comparison that should have taken about five seconds with a bit of practice. The formats are not difficult. They are just unfamiliar to anyone who has not deliberately learned the conversions, and the unfamiliarity costs money.
UK racing has traditionally used fractional odds — the 11/4, 9/2, 5/1 notation that has been part of bookmaker culture for over a century. The on-course bookmaker pitches still use fractional. Most TV graphics still default to fractional. The Gambling Commission’s £766.7m GGY figure for UK racing in the year to March 2025 reflects a market predominantly priced in fractional. But online operators increasingly offer a decimal toggle, exchanges quote in decimal as a default, and the global racing market — particularly for international punters and for cross-product comparison — runs in decimal. The £1.6bn decline in online UK racing turnover since 2022 partly reflects punters moving between operators and products with different default formats, and the format-switching habit is one of the small but real edges in modern racing.
This piece walks through the three main formats, the implied probability calculation, and the practical question of which format to use when.
Read our detailed review of Horse Racing Tipsters UK — How to Audit Their Records.
Fractional odds — the UK default
Fractional odds express the bet return as a ratio of profit to stake. The notation “5/1” means you win £5 for every £1 staked, plus the stake back. The notation “9/2” means £9 profit for every £2 staked, plus the stake back. The fraction can have any numerator and denominator that produces a clean ratio.
The maths. Total return = stake × (numerator/denominator) + stake. So £10 at 5/1 = £10 × 5 + £10 = £60 total return, of which £50 is profit. £10 at 9/2 = £10 × 4.5 + £10 = £55 total, £45 profit. £10 at 11/4 = £10 × 2.75 + £10 = £37.50, £27.50 profit.
Reading mid-range fractions. The fractions between common denominators take practice. 11/4 is 2.75 to 1, sitting between 5/2 and 3/1. 9/4 is 2.25 to 1, between 2/1 and 5/2. 13/2 is 6.5 to 1, between 6/1 and 7/1. The mid-range fractions are common in handicaps where the prices are densely populated, and reading them fluently is part of basic UK racing literacy.
Odds-on prices. When the implied probability exceeds 50 per cent, the fraction reverses — “1/2” means £1 profit for every £2 staked, plus the stake. The notation can be confusing when first encountered because it implies a loss for the same stake/return notation as standard fractional. “1/2 odds on” means a £10 bet returns £15 total — £5 profit on £10 staked. “4/9 odds on” returns £14.44 on £10 — barely more than the stake. Heavy odds-on favourites are common in small fields and Group races, and reading the notation is essential. “Even money” or “Evens” is the boundary — equal stake and profit, £10 returns £20.
The advantage of fractional. The format expresses returns in stake-equivalent units, which is intuitive for casual punters who think in terms of profit on a unit stake. “5/1” tells you you make five times your money if it wins. “11/4” tells you you make about two and three quarter times your money. The notation maps naturally to mental arithmetic for the common fractions.
The disadvantage. Comparing different fractions requires conversion. Is 11/4 better than 5/2? (Yes, 2.75 versus 2.5.) Is 9/4 better than 11/5? (Slightly — 2.25 versus 2.2.) The arithmetic is not difficult, but it slows down price comparison across markets and operators, and the slowdown costs money over time as you miss the best available price.
Decimal odds — the global standard
Decimal odds express the total return per unit staked, including the stake itself. “6.0” means a £1 bet returns £6 total — £5 profit plus £1 stake. “3.75” means £3.75 total — £2.75 profit plus £1 stake. The format includes the stake in the headline number.
The maths. Total return = stake × decimal odds. £10 at 6.0 = £60 total. £10 at 3.75 = £37.50 total. £10 at 5.5 = £55 total. The arithmetic is single-step multiplication, no addition required.
The conversion from fractional. Decimal = (numerator / denominator) + 1. So 5/1 = 5 + 1 = 6.0. 11/4 = 2.75 + 1 = 3.75. 9/2 = 4.5 + 1 = 5.5. The conversion is consistent and quick once practised. Operators with a decimal toggle in their interface usually let you switch the default display to whichever format you prefer.
The conversion back. Fractional = (decimal − 1) expressed as a fraction. So 6.0 = 5/1. 3.75 = 11/4. 5.5 = 9/2 (because 4.5 = 9/2). The reverse conversion is less commonly needed for UK punters because the fractional notation is the traditional one and the decimal is increasingly the convenient one.
Why decimal is the global standard. Decimal is the standard format in continental Europe, Australia, New Zealand, and exchange products globally. The reason is operational efficiency — single-step arithmetic, easier price comparison, no ambiguity around odds-on prices (a 1.5 decimal odds is immediately clear as a return below a 2.0). Exchange products (Betfair, Smarkets) operate in decimal as default because the price-tick structure is finer than fractional and decimal expresses the fine increments cleanly.
The price-tick comparison. Decimal odds tick in finer increments than fractional. Between 5/1 (6.0) and 11/2 (6.5), decimal can express 6.1, 6.2, 6.3, 6.4. Fractional jumps from 5/1 to 11/2 with limited intermediate prices. On liquid exchange markets the decimal tick size matters because the bid-ask spread can be a single tick — invisible in fractional but real in decimal.
American and other formats
Beyond fractional and decimal, two other formats appear in international markets and occasionally in UK racing software.
American (moneyline). The format uses positive and negative numbers around the £100 base unit. “+500” means a $100 bet wins $500 (equivalent to 5/1). “−200” means a $200 bet wins $100 (equivalent to 1/2 in fractional, or 1.5 in decimal). The format is the default in US sports betting and appears in some international racing markets.
The conversions. Positive American to decimal: decimal = (American / 100) + 1. So +500 = 5 + 1 = 6.0. Positive American to fractional: fractional = American / 100. So +500 = 5/1. Negative American to decimal: decimal = (100 / |American|) + 1. So −200 = 0.5 + 1 = 1.5. Negative American to fractional: fractional = 100 / |American|. So −200 = 1/2.
Hong Kong odds. Identical to decimal odds minus one — they express profit per unit stake rather than total return per unit stake. So 5.0 in Hong Kong is 6.0 in decimal, or 5/1 in fractional. The format is the default in Hong Kong racing and shows up occasionally in Asian-facing UK racing products.
Indonesian (Indo) odds. A variation on American with the £100 base scaled to 1.00. +5.00 in Indo is +500 in American. −2.00 in Indo is −200 in American. The conversion is simply dividing the American format by 100.
The practical relevance. Most UK punters do not need to engage with American, Hong Kong or Indonesian formats day-to-day. The exception is punters who compare prices across international operators, particularly on international racing markets where the home format may differ. The conversions are mechanical and the quick rules above cover the common cases.
Find the best options for best betting horse racing.
Implied probability — the question the formats all answer
The single most useful number derivable from any odds format is the implied probability — the bookmaker’s mathematically embedded view of the horse’s chance of winning. Reading the implied probability fluently across formats is the most useful odds skill a punter can develop.
The decimal calculation. Implied probability = 1 / decimal odds. A horse at 6.0 has implied probability 1/6.0 = 16.7 per cent. A horse at 3.75 has 1/3.75 = 26.7 per cent. A horse at 1.5 has 1/1.5 = 66.7 per cent. The arithmetic is simple division and the answers are directly comparable across markets.
The fractional calculation. Implied probability = 1 / (fractional + 1) — using the fraction as a decimal. 5/1 = 1 / (5+1) = 16.7 per cent. 11/4 = 1 / (2.75 + 1) = 26.7 per cent. 1/2 odds on = 1 / (0.5 + 1) = 66.7 per cent. The arithmetic is the same answer reached through fractional intermediate notation rather than decimal.
The overround. Add the implied probabilities of every runner in the race. A fair market would total exactly 100 per cent. UK racing markets typically run between 108 and 115 per cent — the excess over 100 is the overround, representing the bookmaker’s theoretical margin. The overround is higher in markets with more runners (where the bookmaker has more places to bury margin) and lower in small-field Group races where the prices are tighter.
The value-betting application. Once you can read implied probability from any format, the value-betting question becomes mechanical. Estimate the horse’s true probability using form analysis. Compare with the implied probability adjusted for overround (divide raw implied probability by the book percentage to get the market-adjusted figure). If your estimate is higher than the market-adjusted implied probability by a meaningful margin — five percentage points on a non-favourite is a reasonable threshold — the bet has positive expected value. For more on how implied probability connects with the broader value-betting framework, the value betting horse racing UK guide covers the analytical approach in detail.
The book-percentage rule of thumb. UK racing markets running below 108 per cent are tight by current standards. Markets above 115 per cent are wide. The on-course bookmaker market at the off is usually the tightest available — the open market right before the off — because the on-course operators are competing actively with each other and with the exchange. The morning ante-post markets are typically wider because the prices are set without the same competitive pressure.
The format-switching habit
The clean discipline. Set your operator account to display whichever format you read fastest — most punters under 40 prefer decimal, most over 50 prefer fractional, but the choice is personal. Practise the conversion between formats until you can convert mentally inside five seconds. Calculate implied probability from any format you encounter, in your head, on every bet. Compare implied probability across operators and across formats to identify the best available price. The arithmetic is mechanical, the habit is what matters, and the cumulative effect over a year of punting is meaningful. The Lingfield punter who needed ninety seconds to compare 11/4 with 3.7 was paying a price for the comparison delay. The format-switching habit removes the delay and recovers the price.
Why do UK race results screens still default to fractional odds?
UK racing has used fractional odds for over a century, and the convention is embedded in race-commentator language, TV graphics, on-course bookmaker pitches, and the broader culture of the sport. The starting price reporting infrastructure (operated by the on-course bookmaker industry) publishes prices in fractional, and the racing press continues to use the format as the default. Online operators have added decimal toggles in the customer interface but the public-facing communication remains fractional, and that pattern is unlikely to change quickly.
How do I quickly check if a price is value using decimal odds?
Calculate implied probability as 1 divided by the decimal odds. Adjust for overround by dividing the raw implied probability by the book percentage (sum of implied probabilities across all runners). Compare with your own estimate of the horse’s true chance from form analysis. If your estimate is higher than the market-adjusted implied probability by a meaningful margin — five percentage points on a non-favourite is a reasonable rule — the bet has positive expected value. The arithmetic takes about ten seconds with practice.
Published by the Best Betting Horse Racing team.