Value Betting Horse Racing UK — Finding Mispriced Runners
 Available in US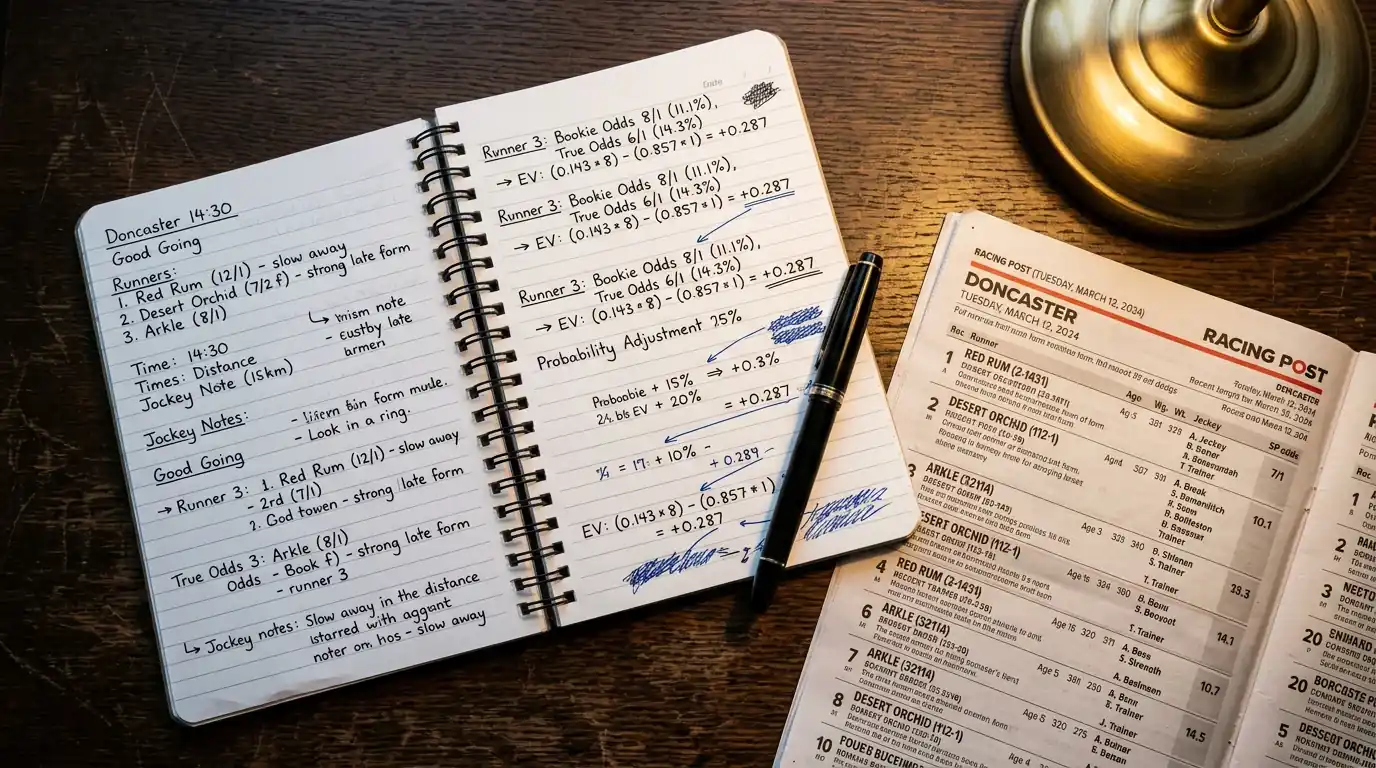
Table of Contents
What value betting actually is — and what it is not
The first thing a value bettor learns to do, usually painfully, is separate two things in their head that almost everyone else conflates. Picking winners and finding value are not the same skill. They are not even cousins. You can pick winners and lose money, and you can pick losers and make money, and over a long enough sample the second profile turns out to be the profitable one.
A value bet is a bet where the price on offer implies a probability lower than the real probability of the horse winning (or placing, depending on the bet). The cleanest way I can put it is this. The bookmaker is offering 5/1 — that is a 16.7 per cent implied chance. You believe the horse has a 25 per cent real chance. The bet has positive expected value. The horse might still lose, and probably will, but the bet was the right action.
That conceptual leap — caring about the price relative to probability rather than which horse wins the race — is the gate between profitable punting and the long, expensive drift that traps about 95 per cent of recreational bettors. Online racing turnover has fallen by around £1.6bn since 2022 according to Gambling Commission data, with the inflation-adjusted loss closer to £3bn. Most of that money was spent backing winners that were not value. This guide walks through implied probability, the maths of overround, how to estimate true probabilities for UK racing, what an overlay actually looks like, and the sample size you genuinely need before drawing conclusions about your own results.
You may also find Cookie Policy interesting.
Implied probability from any odds in your head
The most useful arithmetic in racing fits on the back of a betting slip. Implied probability from decimal odds is one divided by the decimal price. A horse at 4.0 carries an implied probability of 1 ÷ 4.0 = 25 per cent. A horse at 6.0 carries 16.7 per cent. A horse at 2.5 carries 40 per cent. Once you can do that conversion in your head, half the value-betting equation is in place.
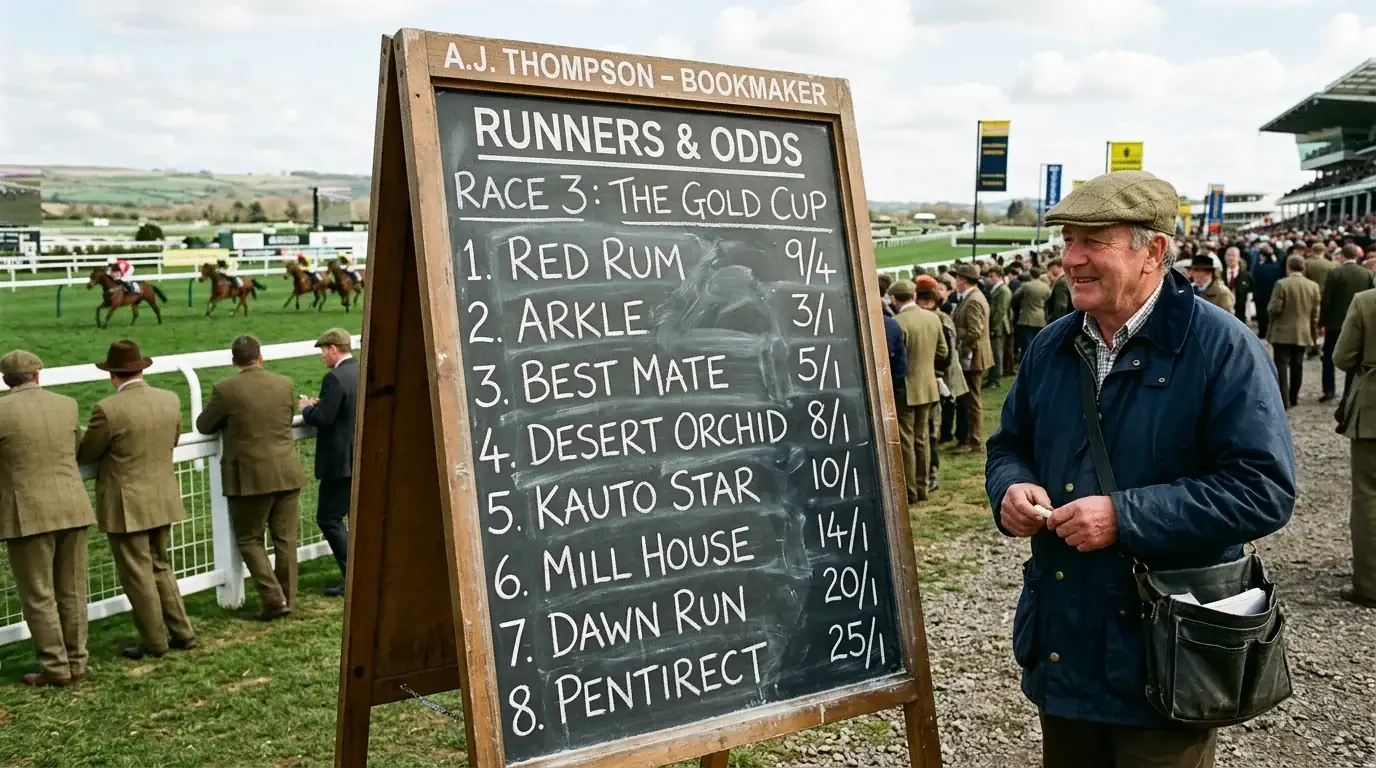
Fractional odds. The conversion is one divided by (the fraction plus one). So 5/1 = 1 ÷ 6 = 16.7 per cent. 11/4 = 1 ÷ (11/4 + 1) = 1 ÷ 3.75 = 26.7 per cent. 9/2 = 1 ÷ 5.5 = 18.2 per cent. With enough practice this becomes automatic — and serious punters do convert mentally on every price they see, because the conversion is the bedrock of every value judgement.
The overround complication. If you add up the implied probabilities of every runner in a race, the total should equal 100 per cent for a fair market. In practice it always exceeds 100 per cent because the bookmaker builds a margin into the prices. A typical UK racing market in 2026 runs at 110 to 115 per cent — sometimes higher in handicaps with many runners. That excess over 100 per cent is the overround, and it represents the bookmaker’s theoretical margin if the prices reflected true probabilities. To work out a horse’s “fair” market-implied probability — adjusted for overround — divide the raw implied probability by the overround. If the book is 112 per cent and your horse is at 5/1 (16.7 per cent raw implied), the overround-adjusted market probability is 16.7 ÷ 1.12 = 14.9 per cent. That is the figure to compare to your own estimate of true probability.
The corollary matters. A market running at 115 per cent overround in a 16-runner handicap is a tougher market to find value in than the same race priced at 108 per cent. The juice scales — bigger overround means smaller value windows, and more runners means more places for the bookmaker to bury the margin.
Estimating true probability — without becoming a quant
Estimating the true probability of a horse winning a UK race is the central craft of the value bettor. There are people doing this with serious data science, custom models, decades of variables and millions of historical runs. There are also people doing it perfectly profitably with a notebook, a copy of the Racing Post and a working knowledge of four or five key form factors. The maths between them is mostly about discipline, not technology.
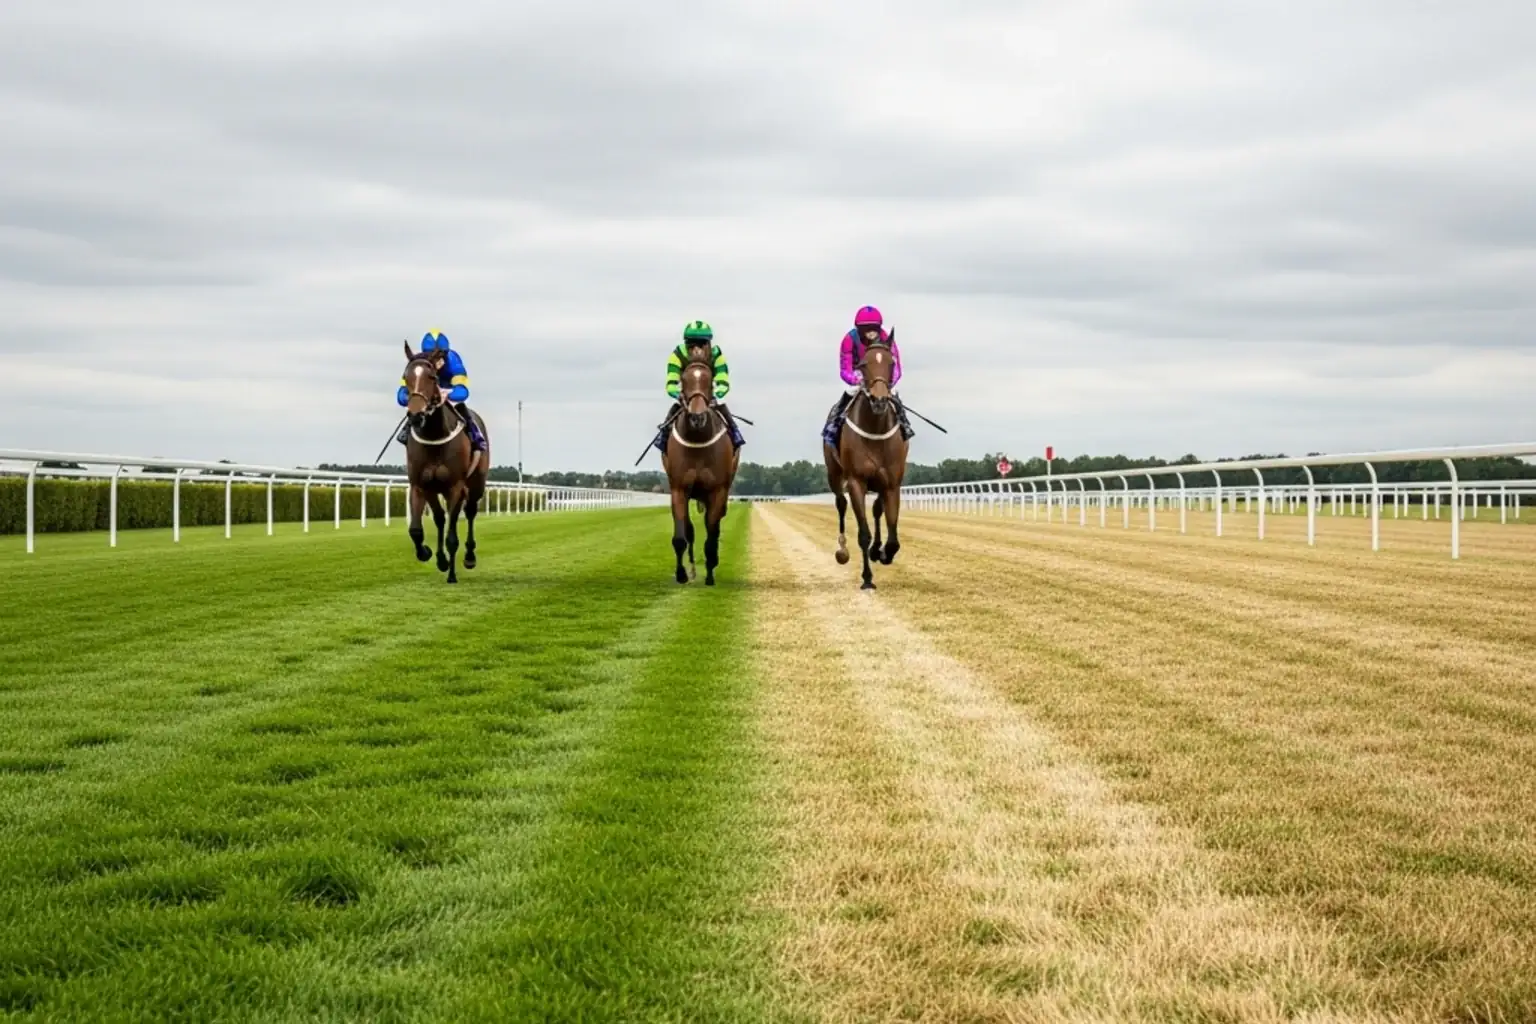
The factors that move the needle most on UK turf. Speed figures — Racing Post Rating and Topspeed for the morning sites, Timeform performance figures alongside — give a baseline ability assessment. A horse rated five pounds higher than the second favourite, all else equal, should be priced shorter than it sometimes is on debut for a new trainer. Distance form. Look at the horse’s record over the exact distance, not over similar distances. Six furlongs and seven furlongs are different races at most UK courses. Going form. A soft-ground horse running on a quick surface is often a longer price than its rating suggests, and rightly so — but the reverse is the bet, when a soft-ground horse is being undervalued because it has shown its best form on a surface that does not appear on its recent figures. Trainer strike rate. Trainers go in and out of form on cycles that run weeks at a time. A trainer at 25 per cent on its last 14 days is a different proposition from the same trainer at 8 per cent. Jockey-trainer combinations. The booking is information — when a stable’s first-string jockey rides one of the smaller runners, the market should notice.
Add the factors mentally. The number you arrive at is your estimate. Compare to the market-adjusted implied probability. If your number is higher than the market’s by a meaningful margin — five percentage points or more on a non-favourite — you have an overlay. If your number is below the market’s, you have an underlay. The bet is on the overlay.
Out of 1,423 high-rated Flat horses (90+ performance figure) in training in the UK in 2025, the market correctly identifies the top dozen most weeks. The errors are in the middle of the field — the horses rated in the high 80s that the market prices at the low 90s, and the horses rated in the low 90s that get priced like top-ten material because they ran second in a recent Group race. That middle band is where the value-betting work lives.
Learn more about best betting horse racing on our main page.
Overlay versus underlay — and where to find each
The overlay is the price that is too long. The underlay is the price that is too short. Both exist in every UK racing market, and finding them efficiently is a matter of knowing which races to look at.
Markets where overlays cluster. Small handicaps where a horse with strong claims has not run for sixty or ninety days. Maidens where a well-bred debutant from a smaller yard is being priced against a runner from a fashionable stable on form alone. Soft-ground races where a horse’s only good run on soft is buried in last season’s form. Races where the market favourite has just one strong piece of form and several modest ones — the price compresses too tightly on the top, leaving the second through fifth in the betting at longer prices than they deserve. The Big Punting Survey identifies these structural inefficiencies year after year. They do not close even when serious money tries.
Markets where underlays cluster. Hot favourites in Group races where the price has been bid down by sentiment money. Stable jockeys riding for a stable that has not won in three weeks. Recent winners running off a substantial rise in the weights. The market over-weights the most recent run, particularly the most recent win, and the price on the back of a win is almost always shorter than the next race justifies.
The discipline. You are not trying to be right on every selection — you are trying to be right on the price. A 12/1 horse that wins the race is a bigger result than a 5/4 horse that wins, but the question for the value bettor is whether the 12/1 was a fair price for a 6 per cent chance. It might have been. It might also have been an underlay if the real probability was 4 per cent. The win does not validate the bet.
Sample size — why your spreadsheet is lying to you
Most punters massively overestimate what they can conclude from a small run of results. The maths is unforgiving. To assert with reasonable confidence that you have a 5 per cent ROI edge over the market, you typically need around 500 to 1,000 bets, and the bigger the average price you back, the larger the sample needs to be.
The variance explanation. A bet at 5/1 wins about one time in six. Across 50 bets at 5/1, you might win seven times (above expectation), or three times (below), and the difference between those outcomes is roughly 18 units of profit. That swing dwarfs any plausible edge you could measure. The standard deviation of your results over 50 bets at this price is far larger than the size of the edge you are trying to demonstrate.
Across 500 bets, the noise begins to settle and the signal becomes visible. Across 1,000 bets, you can speak with reasonable confidence about whether your strategy has a positive ROI. Below 200 bets at a typical price, your win rate tells you almost nothing about your underlying edge. The Big Punting Survey work suggests most casual punters change strategy after losing runs of 10 to 15 bets — runs that statistically would happen even to a punter with a substantial positive edge.
One operator-side fact reinforces the point. The director of racing at the BHA observed in the 2025 quarterly report that total betting turnover fell nine per cent compared with the same period in 2024, calling out that there would be a wide range of factors contributing to the concerning decline. Operators saw that decline in real-time, with sample sizes vastly larger than any individual punter has access to. If they need quarterly figures to draw a confident conclusion, an individual punter assessing their own strategy on 50 bets is reading noise.
The value-bet operational checklist
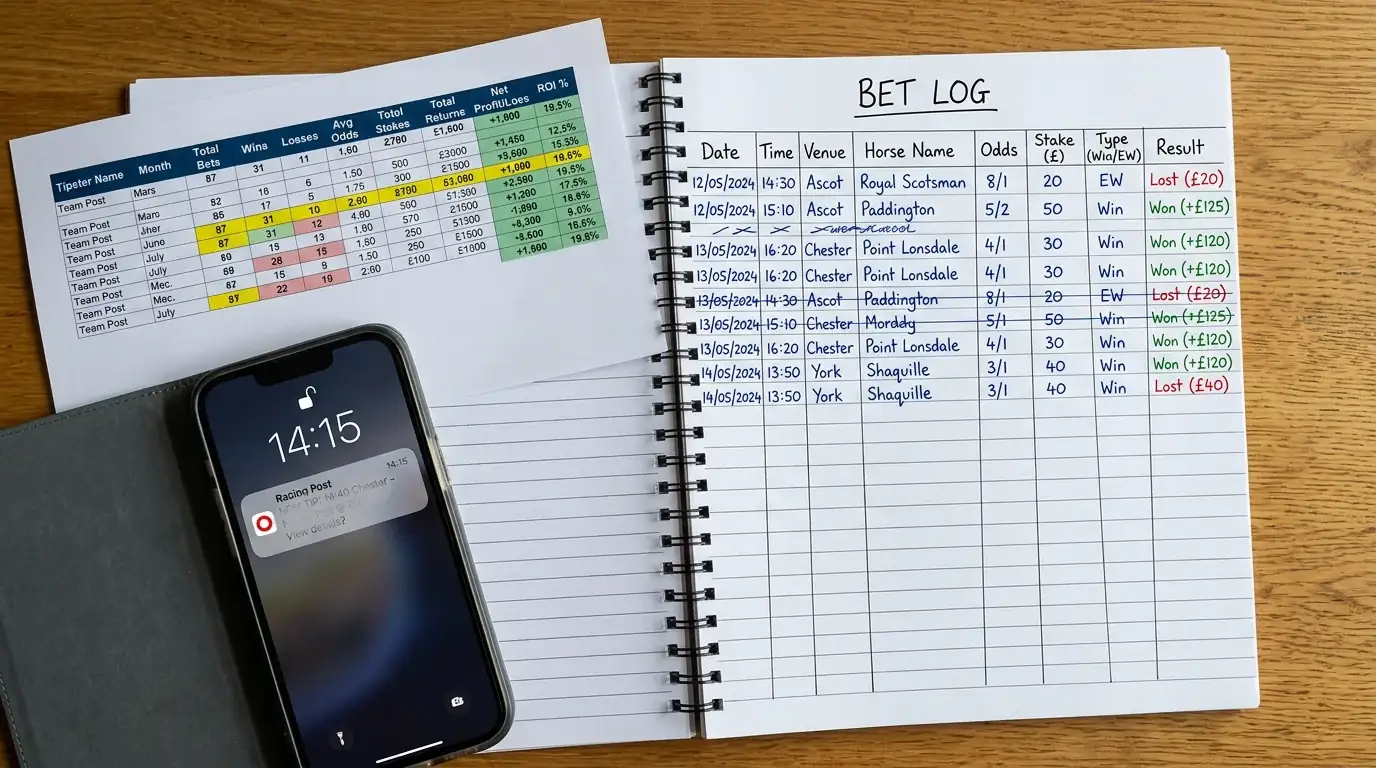
The discipline that turns the theory into actual money. Calculate the implied probability of every price you consider, in your head, before placing the bet. Adjust for the overround by dividing by the book percentage. Estimate the horse’s true probability using two or three form factors you trust. Place the bet only when your estimate exceeds the market-adjusted implied probability by a meaningful margin — five points on a non-favourite is a reasonable threshold. Track every bet to advised prices. Resist changing approach inside 200 bets. The combination of these habits is what turns value betting from a concept into a workable approach. For the broader picture on how value sits alongside bankroll, staking and other building blocks, the UK horse racing betting strategies guide ties it together.
How is overround calculated in a UK horse racing market?
Sum the implied probabilities of every runner in the race. Each horse’s implied probability is one divided by its decimal odds (or one divided by the fraction plus one for fractional). A perfectly fair market would total 100 per cent. Anything above 100 per cent is the overround. UK racing markets typically run between 108 and 115 per cent, with wider books on large-field handicaps.
Why do most punters confuse picking winners with value betting?
Picking winners is intuitive and emotionally satisfying — you watch the horse cross the line and you collect. Value betting is mathematical and counter-intuitive — you might back losing horses for months because the prices were genuinely too long. The two skills look similar but produce very different long-run results. Picking winners with no regard to price is a loss-making strategy when bookmaker overrounds are factored in.
Created by the ”Best Betting Horse Racing” editorial team.